文章目录
缘由
之前在做跨桌面端应用选型时,主要是为了信创认证,进行了一系列的折腾,从Avaloniaui UI 框架 到 Web 框架 electron 然后又转向了 QT UI 框架,当然最后由选择了 Avaloniaui 框架。
这个折腾,让我们耗费了几个月时间,开始选择 Avaloniaui 框架的原因是公司有部分开发人 有开发 wpf 应用的经验,Avaloniaui 框架基于 .net core 又是开源的,上手很快。但是因为各种原因又不选 Avaloniaui UI 框架。上头想UI 层 Web化,对于数据逻辑与 web 进行分离,web 化的框架,一个是使用 CEF 浏览器,自己对调用操作系统 API 这层进行封装。 一个是使用 electorn 框架,此外使用 tauri。
使用 CEF 浏览器和 electron 框架能保证 UI 层的一致性,但是 electron 对系统能力的调用做了封装,减少了使用 CEF 浏览器需要自己封装的系统能力这一层的工作量。
tauri 后端使用 rust 进行编写,看起来很美好,存在三个问题,
一个是 UI 层的不统一,前端应用一大部分工作是在写页面。tauri 是调用系统 webview 。不同的操作系统 webview 不一样。在兼容性与性能上存在较大差别。在 windows 可以使用 webveiw2,性能还可以,在信创系统上,系统的 webview性能很差。此外 css,javascript ,浏览器端 API的兼容能力也是个问题。
一个是 IPC 通信的延迟。当处理巨量数据,比如上千万条数据排序时,肯定是放到独立的进程进行处理,然后将处理好输出转个渲染进程。tauri 在 IPC 通信的延时相比 electorn 的差距很大。
另一个是系统 API调用,tauri 系统 api 调用远低于 electorn。很多能力需要自己实现。
如果选用 tauri ,需要踩的坑太大了。
那为什么不使用 electorn,内存占用大是一个原因,还有是 chromium 在 116版本之前 不支持任何元素的画中画能力,但我想页面中某个表格或图表脱离当前的窗口,为独立窗口显示时。只能创建新窗口,但是创建新窗口,与新窗口融合到原来页面,这个表格或图表相关的状态数据需要存储起来,并在新窗口进行重新执行,这个工作需要开发者实现,工作量大。最终放弃 electorn。
放弃了 QT 的原因是,c++ 的内存安全性问题。开发人员能力层次不齐,开发规范与code review 并不能从根上解决这个问题。
基于上述原因最终选择了 Avaloniaui UI 这个框架。
picture-in-picture
chrome 70 首次 引入了 picture-in-picture 能力,不过这个时候只支持 vedio 标签 picture-in-picture 能力。这个并不能扩展 web 端的能力。比如我需要时候观看某个图表的更新。但是我又需要切换到其他页面。这个时候是比较难做的。
但是自 chrome 116 开始,就支持 了任何标签的画中画能力。在 chrome130 新增了preferInitialWindowPlacement 属性
preferInitialWindowPlacement 属性
preferInitialWindowPlacement 属性 为 true是能够记住画中画的设置,比如,我第一次启动画中画,对画中画的位置进行了移动。当关闭画中画时,再次打开画中画,会记住第一次移动的位置。
如下视频所示
怎么唤起画中画
画中画的唤起通过documentPictureInPicture.requestWindow API 唤起。示例代码如下所示
async trigger() {

                try {
                    const pipWindow = await documentPictureInPicture.requestWindow({
                        width: config.chartDimensions.width,
                        height: config.chartDimensions.height,
                        disallowReturnToOpener: true,
                        preferInitialWindowPlacement: false
                    });

                } catch (err) {
                    console.error('Picture-in-Picture failed:', err);

                }
            }
画中画相关事件
进入画中画中事件
通过监听 documentPictureInPicture 上的 "enter" 事件,来监听画中画的打开。
documentPictureInPicture.addEventListener("enter", (event) => {
  const pipWindow = event.window;
});
画中画关闭事件
const pipWindow = documentPictureInPicture.window;
pipWindow.addEventListener("pagehide", (event) => {
   //todo
  });
画中画相关样式
display-mode:picture-in-picture
我们可以使 display-mode:picture-in-picture 来设置画中画中的相关样式
如下所示:
@media all and (display-mode: fullscreen) {
  body {
    margin: 0;
    border: 5px solid black;
  }
}
与 prefers-color-scheme 搭配
代码如下:
@media (display-mode: picture-in-picture) and (prefers-color-scheme: light) {
  body {
    background: antiquewhite;
  }
}

@media (display-mode: picture-in-picture) and (prefers-color-scheme: dark) {
  body {
    background: #333;
  }

  a {
    color: antiquewhite;
  }
}
访问画中画的元素
我们可以通过 documentPictureInPicture.requestWindow() 返回的对象或使用 documentPictureInPicture.window 访问画中画窗口中的元素,如下所示。
const pipWindow = documentPictureInPicture.window;
if (pipWindow) {
  // Mute video playing in the Picture-in-Picture window.
  const pipVideo = pipWindow.document.querySelector("#video");
  pipVideo.muted = true;
}
处理画中画窗口中的事件
如下代码所示
const pipWindow = documentPictureInPicture.window;
if (pipWindow) {
  // Mute video playing in the Picture-in-Picture window.
  const pipVideo = pipWindow.document.querySelector("#video");
  pipVideo.muted = true;
}
完整的示例
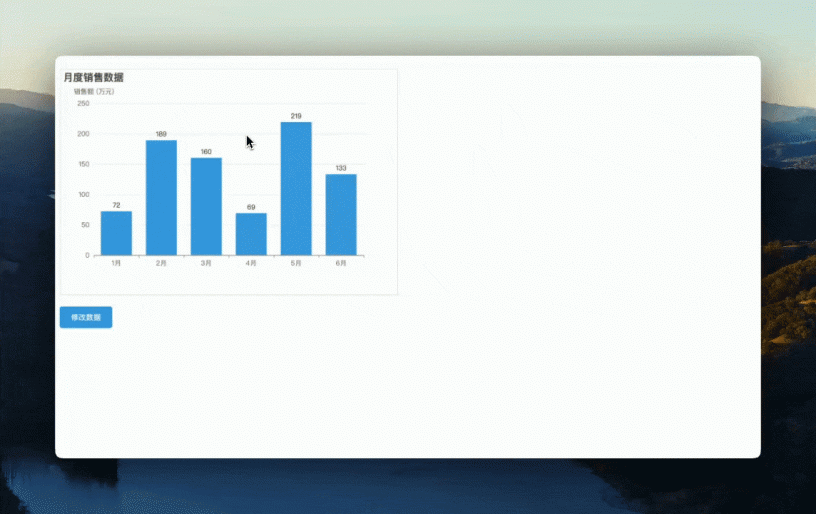
下面是一个画中画完整示例,演示 demo 地址:https://static.alonehero.com/h5-test/picture-in-picture.html
代码如下:
<!DOCTYPE html>
<html>

<head>
    <meta charset="UTF-8">
    <script src="https://cdnjs.cloudflare.com/ajax/libs/echarts/5.4.3/echarts.min.js"></script>
    <style>
        /* Container styles */
        .chart-wrapper {
            width: 600px;
            height: 400px;
            position: relative;
        }

        #chart-container {
            width: 600px;
            height: 400px;
            position: absolute;
            cursor: move;
            background: white;
            border: 1px solid #ddd;
            transition: transform 0.3s ease;
        }

        /* Original position indicator */
        .original-position {
            width: 100%;
            height: 100%;
            border: 2px dashed #ccc;
            position: absolute;
            pointer-events: none;
            opacity: 0;
            transition: opacity 0.3s ease;
        }

        .original-position.visible {
            opacity: 1;
        }

        /* Button styles */
        .update-button {
            padding: 10px 20px;
            background-color: #3398DB;
            color: white;
            border: none;
            border-radius: 4px;
            cursor: pointer;
            transition: background-color 0.3s;
        }

        .update-button:hover {
            background-color: #2779BD;
        }

        /* Picture-in-Picture mode styles */
        @media all and (display-mode: picture-in-picture) {
            body {
                position: relative;
                width: 600px;
                height: 400px;
                overflow: hidden;
            }

            #chart-container {
                width: 600px;
                height: 400px;
                position: absolute;
                top: 0;
                left: 0;
            }
        }
    </style>
    <title>画中画演示</title>
</head>

<body>
    <h2>画中画演示,拖动下面图表 可以触发画中画</h2>
    <div class="chart-wrapper">
        <div class="original-position"></div>
        <div id="chart-container"></div>
    </div>
    <br />
    <button class="update-button">修改数据</button>

    <script>
        // Configuration and state management
        const config = {
            chartDimensions: {
                width: 600,
                height: 400
            },
            dragThreshold: 10, // percentage threshold for PiP trigger
            months: ['1月', '2月', '3月', '4月', '5月', '6月']
        };

        const state = {
            isDragging: false,
            currentX: 0,
            currentY: 0,
            initialX: 0,
            initialY: 0,
            xOffset: 0,
            yOffset: 0,
            isPiPActive: false
        };

        // DOM Elements
        const elements = {
            container: document.getElementById('chart-container'),
            wrapper: document.querySelector('.chart-wrapper'),
            originalPosition: document.querySelector('.original-position'),
            updateButton: document.querySelector('.update-button')
        };

        // Chart Management
        class ChartManager {
            constructor(container) {
                this.chart = echarts.init(container, null, {
                    devicePixelRatio: window.devicePixelRatio
                });
            }

            getBaseOption() {
                return {
                    title: {
                        text: '月度销售数据'
                    },
                    tooltip: {
                        trigger: 'axis',
                        axisPointer: { type: 'shadow' }
                    },
                    xAxis: {
                        type: 'category',
                        data: config.months
                    },
                    yAxis: {
                        type: 'value',
                        name: '销售额 (万元)'
                    },
                    series: [{
                        name: '销售额',
                        type: 'bar',
                        data: this.generateRandomData(),
                        itemStyle: { color: '#3398DB' },
                        label: {
                            show: true,
                            position: 'top'
                        }
                    }]
                };
            }

            generateRandomData() {
                return Array.from(
                    { length: config.months.length },
                    () => Math.floor(Math.random() * 200 + 50)
                );
            }

            update() {
                this.chart.setOption(this.getBaseOption());
            }
        }

        // Drag Management
        class DragManager {
            constructor(element, onOffsetChange) {
                this.element = element;
                this.onOffsetChange = onOffsetChange;
                this.setupEventListeners();
            }

            setupEventListeners() {
                this.element.addEventListener('touchstart', this.dragStart.bind(this));
                this.element.addEventListener('touchend', this.dragEnd.bind(this));
                this.element.addEventListener('touchmove', this.drag.bind(this));
                this.element.addEventListener('mousedown', this.dragStart.bind(this));
                this.element.addEventListener('mouseup', this.dragEnd.bind(this));
                this.element.addEventListener('mousemove', this.drag.bind(this));
                document.addEventListener('mouseup', this.dragEnd.bind(this));
            }

            dragStart(e) {
                if (state.isPiPActive) return;

                state.isDragging = true;
                this.element.style.transition = 'none';

                if (e.type === "touchstart") {
                    state.initialX = e.touches[0].clientX - state.xOffset;
                    state.initialY = e.touches[0].clientY - state.yOffset;
                } else {
                    state.initialX = e.clientX - state.xOffset;
                    state.initialY = e.clientY - state.yOffset;
                }
            }

            dragEnd() {
                if (!state.isDragging) return;

                this.element.style.transition = 'transform 0.3s ease';
                state.isDragging = false;
                this.onOffsetChange();
            }

            drag(e) {
                if (!state.isDragging || state.isPiPActive) return;
                e.preventDefault();

                if (e.type === "touchmove") {
                    state.currentX = e.touches[0].clientX - state.initialX;
                    state.currentY = e.touches[0].clientY - state.initialY;
                } else {
                    state.currentX = e.clientX - state.initialX;
                    state.currentY = e.clientY - state.initialY;
                }

                state.xOffset = state.currentX;
                state.yOffset = state.currentY;
                this.setTranslate(state.currentX, state.currentY);
                this.checkOffset();
            }

            setTranslate(xPos, yPos) {
                this.element.style.transform = `translate3d(${xPos}px, ${yPos}px, 0)`;
            }

            checkOffset() {
                const wrapperWidth = elements.wrapper.offsetWidth;
                const wrapperHeight = elements.wrapper.offsetHeight;
                const xOffsetPercent = Math.abs(state.xOffset / wrapperWidth * 100);
                const yOffsetPercent = Math.abs(state.yOffset / wrapperHeight * 100);

                if (xOffsetPercent > config.dragThreshold || yOffsetPercent > config.dragThreshold) {
                    elements.originalPosition.classList.add('visible');
                    return true;
                }

                elements.originalPosition.classList.remove('visible');
                return false;
            }
        }

        // Picture-in-Picture Management
        class PiPManager {
            async trigger() {
                if (state.isPiPActive) return;

                try {
                    const pipWindow = await documentPictureInPicture.requestWindow({
                        width: config.chartDimensions.width,
                        height: config.chartDimensions.height,
                        disallowReturnToOpener: true,
                        preferInitialWindowPlacement: false
                    });

                    pipWindow.document.body.append(elements.container);
                    state.isPiPActive = true;


                    pipWindow.addEventListener('pagehide', () => {
                        state.isPiPActive = false;
                        this.snapBack();
                    }, { once: true });
                } catch (err) {
                    console.error('Picture-in-Picture failed:', err);
                    this.snapBack();
                }
            }

            snapBack() {
                state.xOffset = 0;
                state.yOffset = 0;
                dragManager.setTranslate(0, 0);
                elements.wrapper.append(elements.container);
                elements.originalPosition.classList.remove('visible');
            }
        }

        // Initialize components
        const chartManager = new ChartManager(elements.container);
        const pipManager = new PiPManager();
        const dragManager = new DragManager(elements.container, () => {
            if (dragManager.checkOffset()) {
                pipManager.trigger();
            } else {
                pipManager.snapBack();
            }
        });

        // Set up event listeners
        elements.updateButton.addEventListener('click', () => chartManager.update());
        documentPictureInPicture.addEventListener("enter", async (event) => {
            dragManager.setTranslate(0, 0);

        });
        // Initial chart render
        chartManager.update();
    </script>
</body>

</html>
其他问题
一个顶级窗口只能打开一个画中画,无法多个画中画共存。
无法从画中画再次打开画中画。画中画必须由顶级窗口打开。


发表评论